Hunting For Zombie Pods
At almost exactly 0300 (UTC) on the morning of 22/05 our monitoring systems started sending alerts for a handful of websites. They had begun to respond slower. This was very strange, the sites weren't down or throwing errors, just slow...
I first turned my attention to the time this started happening, everything started slowing down right at the top of the hour. Was there a cron hammering the clusters CPU? Nope. Was there a problem with our monitoring system? Nope, requesting the sites from other locations showed the same response times. Was it a rogue deployment? Nope.
After this I started looking at other possibilities:
- Was there an AWS outage? Nope, all systems were green
- Was it an automatic update of a CMS? Nope, they were using different CMSes
- Was there some kind of DDOS attack? Nope, traffic appeared normal
- Was there a problem with the Database? Nope, all seemed to be fine
The Smoking Gun
My suspicions now turned towards the storage layer, since at this point it was basically the only moving part I hadn't yet looked at. We use AWS Elastic File Storage (EFS) to store any volatile data our apps consume, and simply mount it to our containers.
So to test if this was the source of the problem I attached to one of the affected containers and tested the time to perform a file touch:
$ time touch /path/to/app/source/testFile


real    0m0.010s

user    0m0.001s

sys     0m0.000s
This was fine but it was a different story for directories mounted via EFS:
$ time touch /path/mounted/to/EFS/testFile


real    0m0.334s

user    0m0.001s

sys     0m0.000s
334ms to just touch a file?! I would expect an increase in latency due to the overheads of the NFS protocol and networking etc but according to EFS FAQ "EFS Standard is designed to provide single-digit latencies on average...". This at least explained the issue, all the views, logs, assets etc that an app was reading from disk was taking an age to respond. So.. why?
At this point I opened a ticket with AWS, but while waiting for them to respond I kept digging...
Graphs!
I started rummaging through the plethora of graphs that AWS makes available through Cloud Watch when I saw this:
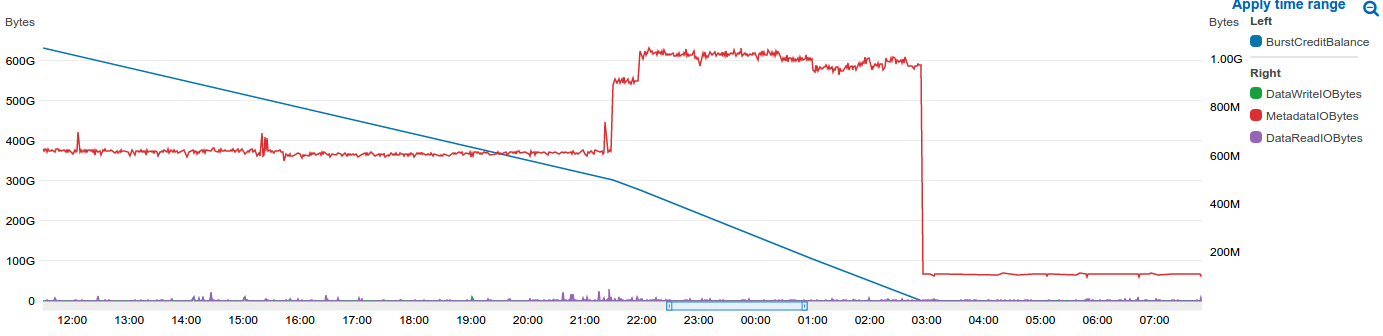
This was the "Well, there's your problem" moment, we had some how managed to exhausted our BurstCreditBalance (the blue line), I won't try to explain how it's calculated because it's complicated, but the short of it is, if you use lots of bandwidth all of a sudden they go down, and if everything is idle they go up. When you exhaust your credits AWS will throttle you, hard, making your apps slow and your customers sad.
This was also the point where I realised that the timing was just a coincidence, it just happens that the credits were exhausted at the top of the hour.
The Why (and more graphs!)
So we have the when and the what, but what about the why? Why did the credits get exhausted. It is immediately clear that something is reading a disproportionate amount of metadata, the metadataIOBytes is several hundred times that of read and write combined!
To get an idea of what was causing this excessive metadata IO I went back in time, it can't have been like this forever:
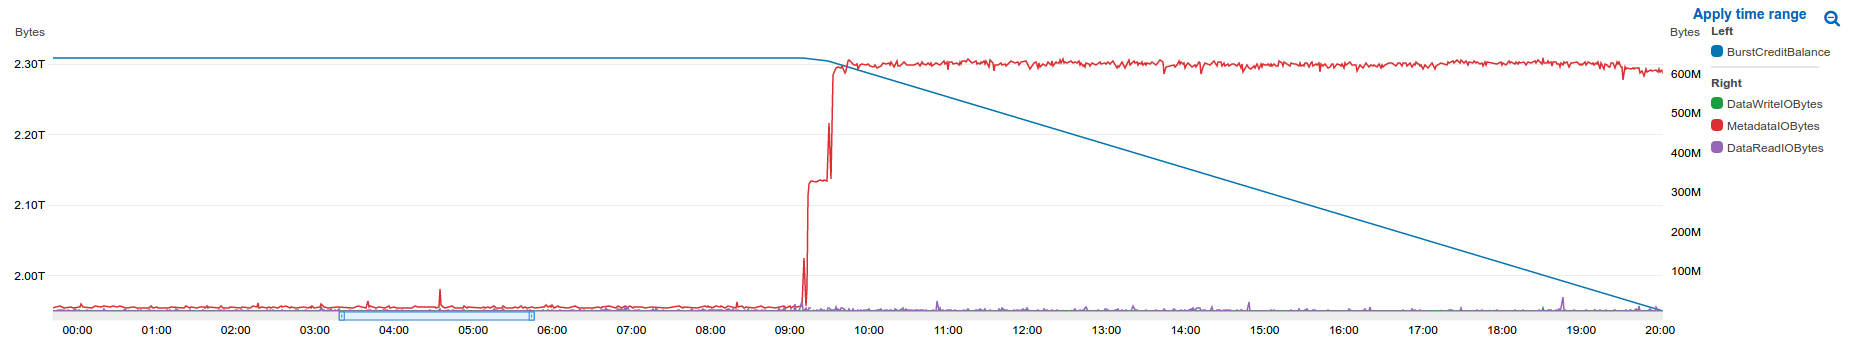 This was 2 days prior! (Don't be fooled by the dynamic axis labelling, the bottom of the left hand axis isn't zero). This was the day we had done a cluster wide PHP upgrade (patching CVE-2019-11048) but it wasn't the upgrade that caused the problem, at least not directly...
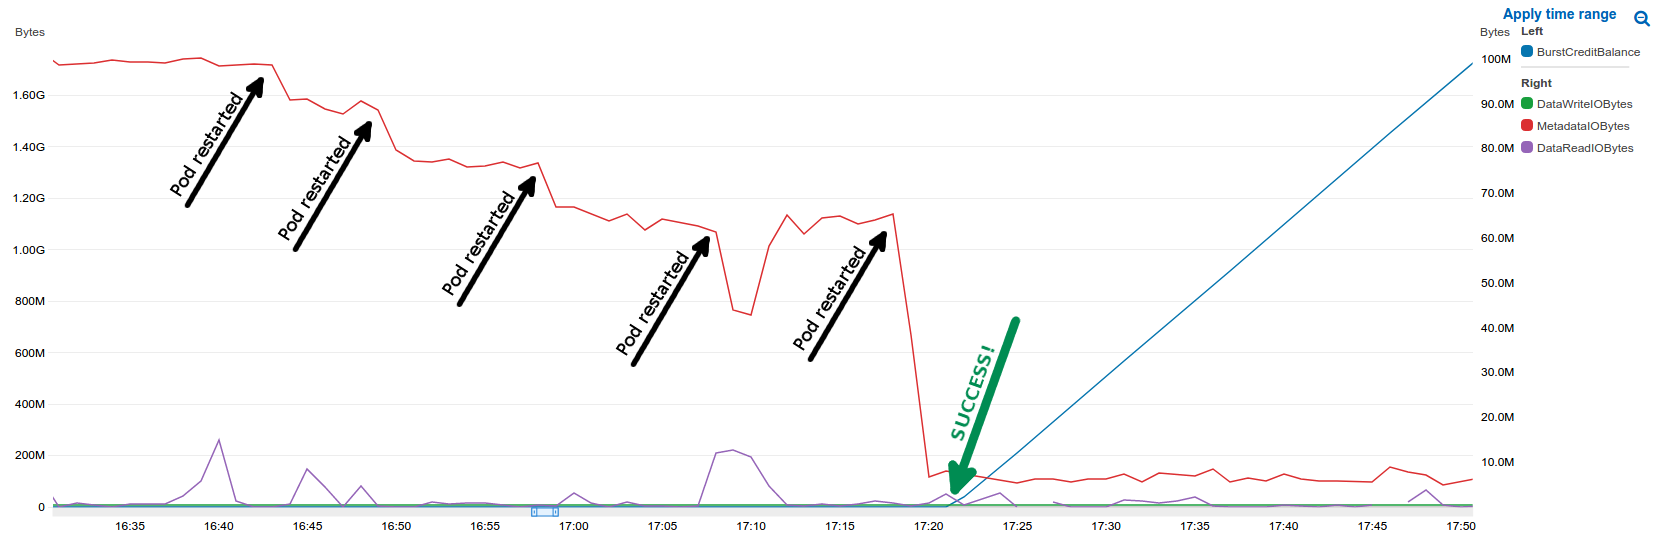
Once we had applied the patches to our container images we had to deploy them. This is where the problem began, just a couple of pods in the cluster failed to be replaced correctly and were left in a "Terminating" state. Annoyingly K8 wasn't able to tell us why and any manual delete commands sent to these pods would just hang...
$ kubectl get pods --all-namespaces | grep Terminating

************       ************-staging-797fbbbc6d-whjpp        0/2     Terminating     0     25h

************       ************-production-56dc6d7dbd-wccmq     0/2     Terminating     0     35d

************       ************-production-588cd5f7cd-g9fxt     0/2     Terminating     0     3d7h

************       ************-production-588cd5f7cd-xmxll     0/2     Terminating     0     3d7h

************       ************-staging-585f86f6d7-ptr7k        0/2     Terminating     0     3d7h

************       ************-staging-585f86f6d7-zpqcc        0/2     Terminating     0     3d7h

************       ************-staging-78b99cd8f8-6ktsh        0/2     Terminating     0     43d

************       ************-staging-78b99cd8f8-hjmtg        0/2     Terminating     0     25d
The only way to be rid of these zombie pods was to reboot the nodes they were scheduled onto, yes the solution was literally to turn it off and on again, not exactly a satisfactory solution but a solution nonetheless. All of our pods are scheduled onto at least 2 nodes so no downtime occurred as a result.
Future Mitigations
I learned a lot during the process of debugging this and there are a few take aways from this incident
Move as much IO off of mounted volumes
One easy win for this is to move caches off the mounted storage as they are designed to be volatile. This should also have the added benefit of improving app performance slightly.
EFS metric alerts
If we had alerts for EFS credit balance we would've been pointed at the problem before it became a problem
Zombie monitoring
Adding monitoring for pods that have been in the terminating state for longer than a few minutes would again give us a heads up that something was up.
Update - 28 May
Like all problems that are "solved" by solutions like switching it off and on again they inevitably comeback again, this was no exception. The difference this time: I was prepared for it.
It was the same symptom, some sites response times increasing though it wasn't as bad as last time, I quickly jumped into the AWS console and checked the graphs, it was the same thing, our BurstCredits were quickly being depleted but we weren't yet being throttled.
This time I SSHed into the affected nodes and ran nfsstat and saw this:
Client rpc stats:

calls      retrans    authrefrsh

7557659    10         7560157


Client nfs v4:

[...]

symlink      create       pathconf     statfs       readlink     readdir

2         0% 97        0% 56490     0% 169612    2% 0         0% 2287316  31%

[...]
The reason for the increase of MetadataIO traffic was a huge number of readdir calls and it was increasing 1000s per second.
Next I turned to inspecting the kublet logs. I Greped for the name of the zombie container and found thousands of lines like this:
kubelet[3851]: W0526 14:51:59.491441 3851 mount_helper_common.go:36] Warning: Unmount skipped because path does not exist: /var/lib/kubelet/pods/{UUID}/volume-subpaths/pvc-{UUID}/{POD_NAME}/sess_,BYpwEHhhJX0FQMQTCO[...snip...]These sess__... files are PHPs session files, these have to be stored in a mounted volume so that users stay logged in regardless of which pod their request was routed to. The files could be missing because of PHPs session garbage collection but it didn't make sense then that it was complaining they were missing, it's like it had lost track of them.
It was at this point I got a response on the support ticket, they linked to two Kubernetes issues (#64137 & #70324). The gist of the issues is that if you run a lot of cron jobs, and we do, there is a CGroup leak which causes the system to run out of file watches (fs.inotify.max_user_watches). This problem stems not from bugs in K8 but in the Linux Kernel (#1847512 & #1846787), well I should say it stemmed from bugs, these bugs have been fixed since v1.15 but as of the time of writing the AWS EKS images are using v1.14. I am told that work is in progress to update these.
The issues mention a couple of work arounds:
- Run a daemon set to increase the number of max_user_watches
- Run a CGroup garbage collector daemon set
- Reboot nodes before they can run out of file watches (this is the reason why switching it off and on again worked initially)
I didn't want to add yet another daemon set to our nodes so frequent rebooting was the only option left, we were already doing this to a certain extent because some of our instances are spot instances which get replaced semi-regularly but what about the ondemand nodes? Well it turns out that killing pods and nodes semi-often is considered a good way to test that your cluster is failure resilient, so called chaos testing, and there are many many many many tools that do just that, delete nodes or pods on a schedule/randomly/conditionally etc.